DESIGNING USING OWN/PERSONAL DATA
GD III – INFORMATION DESIGN
FALL 2018 / SPRING 2019
ILLINOIS STATE UNIVERSITY
COLLEGE OF FINE ARTS
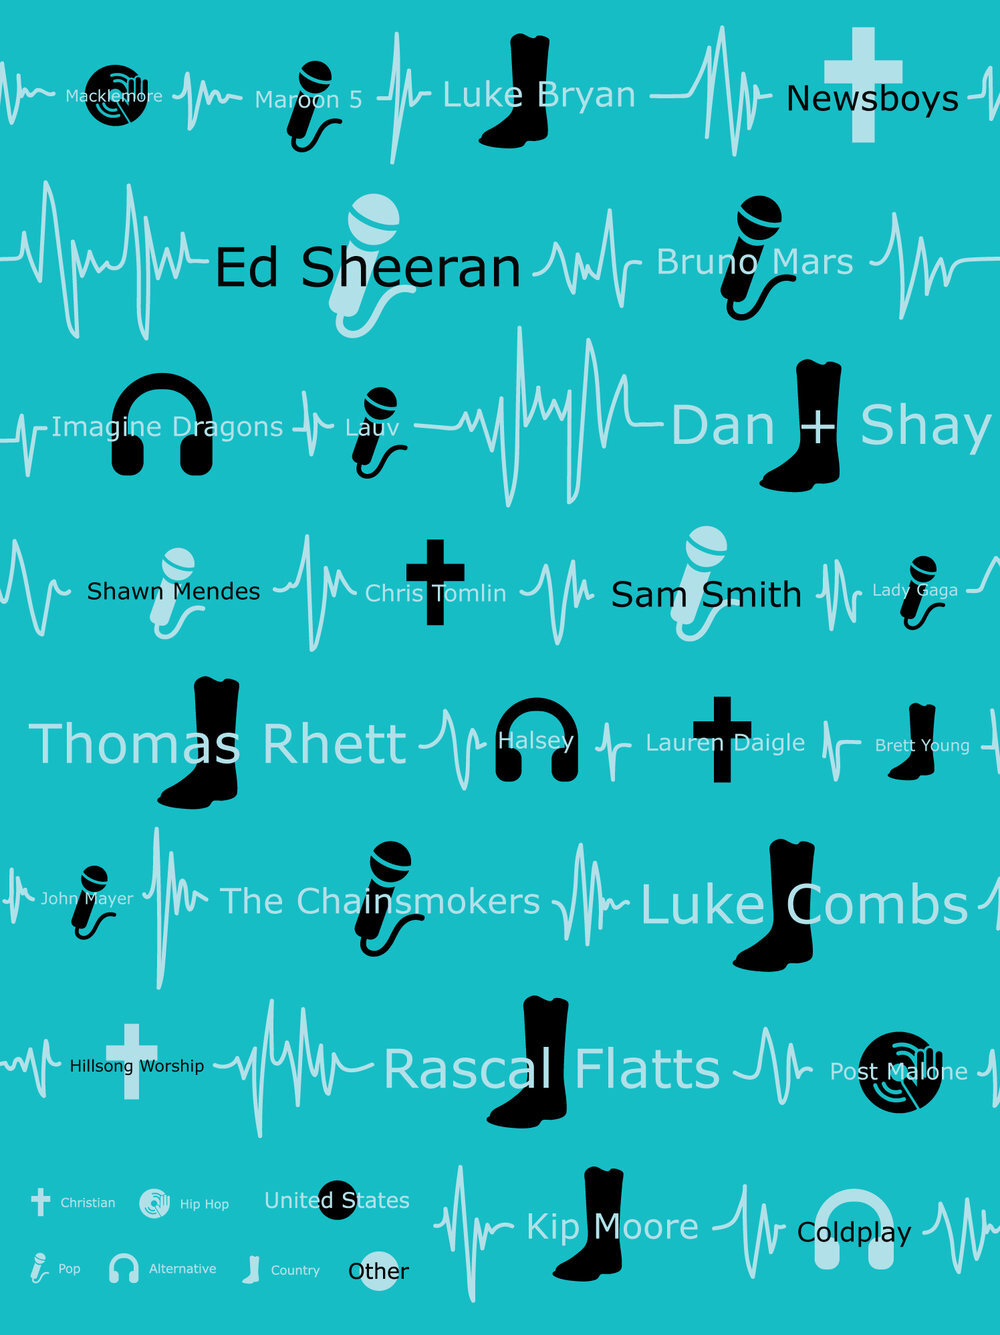
Students were asked to explore the possibilities of visualizing overlapping relationships within categories of information by representing these overlapping categories visually, using typography, scale, color, form, and other cues to indicate connections and difference.
They were asked to compose a list of 25 music artists or groups and include the following three categories of data for each artist or group:
Genre of music
City, state or country of origin
How much they like them (ranking list)
Students were encouraged to organize and categorize the above information and find the relationships between the artists/groups. They were asked to find the overlapping information and relationships, and then visualize these relationships and create informative and dynamic compositions.
* Original project concept belongs to professor Alice Lee
Student: Sophie Hoerr
Student: Remi Sweeney
Student: Rachel Smith
Student: Mason McGuire
Student: Danielle Servelli
Student: Arnie Lack
Student: Julia Schuler
Student: Micah Vetter
Student: Hannah Piemonte
Student: Rachel Poland
Student: Alicia Windisch
Student: Tyler Coda
Student: Ken Harper